
Mobile Mapping and Data Management
Manage Your City Without Going to the Streets
Digitize all your field data with high-resolution 360° panoramic images and intelligent POI management.

If Data Remains Scattered,
The decision cannot be clarified
In organizations, data is often kept in separate sources and in different formats: Excel spreadsheets, field reports, call center complaints, fault logs... This information is often not associated with each other and is far from spatial integrity.
The Geolab Geographic Visualization and Insight Generation solution combines all this data on a common geographic basis. Thanks to its map-based structure, data such as tables, graphs, and documents are integrated with location information. This enables us to access meaning through location, not just numbers.
Managers now have instant answers to questions like, "What happened?" as well as "Where, how often, and in what area was it concentrated?" Field operations are planned more efficiently, interventions are directed to the right locations, and decisions are based on visually supported information.
WHAT PROBLEMS DOES IT SOLVE?
/ 01
Data from different systems cannot be collected on a single integrated platform.
/ 02
Inability to retrieve data from different sources such as database, Excel, web service.
/ 03
Inability to display map, chart and table synchronously on the same screen.
/ 04
Failure to take timely action because data analysis processes take a long time.
/ 05
Inability to quickly communicate data between institutions.
/ 06
Failure to correctly interpret available data.

If Data Remains Scattered, Decisions Cannot Be Clear
In organizations, data is often kept in separate sources and in different formats: Excel spreadsheets, field reports, call center complaints, fault logs... This information is often not associated with each other and is far from spatial integrity.
The Geolab Geographic Visualization and Insight Generation solution combines all this data on a common geographic basis. Thanks to its map-based structure, data such as tables, graphs, and documents are integrated with location information. This enables us to access not only numbers but also meaning through location.
Managers now have instant answers to questions like, "What happened?" as well as "Where, how often, and in what area was it concentrated?" Field operations are planned more efficiently, interventions are directed to the right locations, and decisions are based on visually supported information.
/ 03
Inability to quickly communicate data between institutions.
/ 04
Failure to correctly interpret available data.
/ 03
Inability to display map, chart and table synchronously on the same screen.
/ 04
Failure to take timely action because data analysis processes take a long time.
/ 02
Inability to retrieve data from different sources such as database, Excel, web service.
/ 01
Data from different systems cannot be collected on a single integrated platform.
WHAT PROBLEMS DOES IT SOLVE?
HIGHLIGHTS
Bring All Data Sources Together in a Single Panel and Simplify Analysis

Multi-Source Data Integration
Database connection, Excel import, external data synchronization via API.

Map + Chart + Table Matching
The location of the selected data on the map, the graphic value and the detail table are updated together.

Time Series Visualization
Changes in data distribution can be monitored according to a specific date range.

Filtering and Category Management
Only relevant data is displayed by filtering based on fields such as date, category, unit.

Panel Sharing and Reporting
Created analysis panels can be shared and exported as PDF or Excel.
WHO SHOULD USE IT?
Developed for All Sectors That Rely on Reporting and Analysis
Municipalities (Strategy, Planning, GIS, Information Technology)
Public Institutions and Organizations
Field Control and Operation Centers
Institutional/Company Reporting and Management Decision Support Units


USE SCENARIOS
Real-World Application Areas of the System:
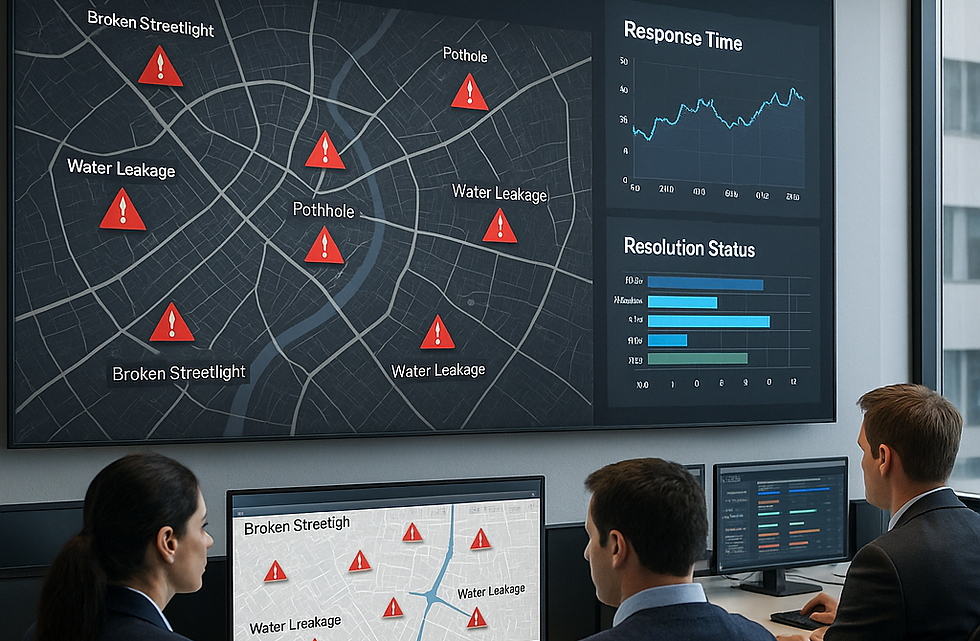
Display of Field Complaints on the Map
Corporate Performance and Operations Management
Demographic and Social Data Analysis
Decision Support Panels

Display of Field Complaints on the Map
Complaint source, response time and outcome are displayed on both a map and a graph.
USE SCENARIOS
Real-life application areas of the system:
Creating a Panoramic Image
Sign & Billboard Management
Pavement & Road Condition Monitoring

It enables fast, low-cost and high-accuracy collection of physical assets and spatial data in the city.
Pavement & Road Condition Monitoring

WHAT DOES IT GAIN?
Collects Scattered Data and Enables Effective Reporting
01.
Eliminates Internal Data Clutter
Disparate systems are brought together under a single roof, eliminating the question of who has access to which data and how.
02.
Creates Data-Based Decision Processes
All reports are updated in real time with the admin screens.
03.
Provides Meaningful Reporting
Not only numbers but also visual explanations are made with maps and graphics.
04.
Saves Time, Reduces Errors
Eliminates the need for manual data processing. Everything is sourced from the system.
05.
Creates Institutional Memory
Data provides an archive not only for the moment but also cumulative archives from past to present.